Share Research Visually
November is Academic Writing Month #AcWriMo at Methodspace! This post was part of the 2017 #AcWriMo series. The theme of week four was: Share Your Work. I asked visual communications expert Lydia Hooper for suggestions. What approaches do you recommend researchers take for using visualizations and images of various kinds to communicate research findings? Is it different for qualitative or quantitative researchers?Like research and writing, creating images requires thoughtful process. I highly recommend that anyone and everyone use a design thinking process. This includes thinking about who your audience is and gathering information about them before developing ideas, and then using sketches or prototypes to test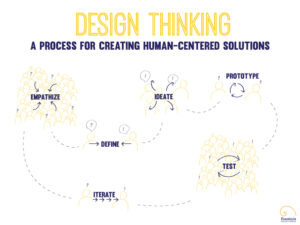 ideas over and over. Something else to consider, whether you are a quantitative or qualitative researcher, is what type of visual serves your goal best. Photos are great if you take them yourself to capture something very specific. Digital graphics created on a computer are great if you can keep them very simple. In my opinion, hand drawings are often the best because they can be specific and approachable, but what they aren’t good for is showing highly technical ideas. Graphic recordings are visuals created during real-time dialogue so can be great coupled with some qualitative methods.How does one "proofread" a visual representation to determine whether the message was presented clearly?A trained eye learns to “proofread” but even we need to test our visuals with real people (ideally, several very different ones, or at least ones who represent those we are trying to communicate with) to learn whether they are clear and how we migh
 t improve them. This is why I am a firm believer in the design thinking approach. It ensures that you are putting the viewer first from the very beginning of your process. That is the best way to develop messages, visual or otherwise, that will resonate and spark new understandings.What software tools do you recommend? Are there free or cheap options available for student or new researchers?There are many online tools and of course software programs for creating visuals, and which to use largely depends on the type of visual you are creating. For those that are data-based, I prefer Tableau Public, but Excel or Google Sheets work too. I also prefer Prezi over Powerpoint (a free version is available). For geographic maps you can use Google Maps or ArcGIS Online (public or education version), and for network maps Kumu is an easy, free option. Regardless of which you choose, I recommend always starting with pen and paper. You have the most options available to work out ideas without fussing with technology until you are clear about what exactly you need to create.What resources are available to help us develop graphics, diagrams, or even photographs that clearly convey ideas and relationships?There are entire fields of study dedicated to this! Namely, art, design, marketing, data visualization, graphic facilitation… You can find a variety of beginner courses online, such as on Skillshare and Lynda. Stanford d.school also has a Virtual Crash Course in design thinking.Some of my favorite thought leaders are Edward Tufte, Alberto Cairo, Cole Nussbaumer Knaflic, Stephanie Evergreen, Dan Roam, Nancy Duarte, and David Sibbet all of whom have written incredibly useful books. To learn more about using visuals to support groups, read Brandy Agerbeck’s Graphic Facilitator’s Guide or Sunni Brown’s The Doodle Revolution (see video) or my own short ebook, Using Visuals to Support Collaborative Work. There’s also a new book called Visual Note-taking for Educators. One of my favorite resources on human-centered design is IDEO.org’s free Field Guide to Human-Centered Design.What’s most important to understand about design-- the study of using images to convey ideas-- is that it is really all about practice. Just like research, if you want to do it well, you can’t just study it, you have to do it. Over and over again. Lydia Hooper specializes in helping organizations collaborate and communicate about complex topics. She has partnered with more than 50 organizations and networks, offering services and trainings in data storytelling, graphic recording, and communications strategy. You can read more blog articles and get a free copy of her ebook “Using Visuals to Support Collaborative Work” at www.fountainvisualcommunications.com.